Introduction
The National Alliance for Media Arts and Culture (NAMAC) is a collective organization of US media arts organization. Through collaborative projects, research, resources and advocacy, NAMAC works to connect, develop and build capacity for media arts organization. Since 2003, the organization has partnered with media scholar Kathleen Tyner of The University of Texas at Austin to conduct four surveys of youth media organizations in the US. The research is intended as an environmental scan of youth media programs to assess their capacity to meet the demand for their services. As a field-building strategy, the results of these studies are used by youth media advocates and practitioners to assess their support systems, challenges and gaps in their capacity to offer and sustain content creation opportunities for young people. In this sense, the studies can also be used for needs assessment, advocacy and strategic planning efforts that contribute to best practices and sustainability for youth media programs.
Some refer to youth media as a “field,” yet consensus is vital for field building, raising questions around practices and boundaries, concepts, relationships and affinity between youth media organizations 1. Moreover, the diverse range of activities, media and missions complicates consensus around best practices and impact that can be used to prioritize and support activities that assess outcomes, build capacity and support sustainability for youth media programs. Much of the existing research discusses youth media within the context of media effects research or critical literacy, resulting in programs related to risk aversion, media literacy and youth development. The research also reflects a strong emphasis on qualitative, ethnographic and action research 2.
Although there is a body of work related to theories and concepts for creative production in the media arts 3, more mixed methods studies related to the impact, best practices and lessons learned from youth’s engagement with creative media production would be useful for field-building strategies 4.
Emerging international efforts to collect evidence of youth media practices in global, cross-cultural contexts broadens the scope of research foundation 567.
Yet much more research is needed to guide evidence-based approaches for youth media organizations’ strategic planning, funding priorities and policy efforts. In particular, few studies exist at this time to accurately map the purposes, practices, number and type of youth media production programs in formal or informal learning environments in the United States. At the least, results could provide evidence of affinity and consensus across youth media programs that could be used for field building. For youth media organizations who are stretched to support a growing interest in media production by youth, a research agenda also provides evidence that can be used to establish planning, priorities and polices that help to build capacity and sustainability for the emerging field of youth media.
Mapping the Field of Youth Media: Results of An Environmental Scan of Youth Media Organizations in the United States is intended as a contribution to the research base for youth media in the United States. Conducted by Kathleen Tyner at The University of Texas at Austin in partnership with the National Alliance for Media Arts and Culture (NAMAC), the study is part of a longitudinal effort to map the field of youth media in the United States from 2003-2013. Additional discussion, information graphics, tables and open-ended comments related to the study’s data sets can be found online 8.
Methodology
Data was collected between April 1 and August 1, 2013, using a convenience sample of youth media organizations from the Youth Media Google Groups and the National Alliance for Media Arts and Culture (NAMAC) membership lists, combined with a rolling sample method. The first questionnaire request was sent via email to 161 advocates and directors of youth media organizations. Respondents accessed an online questionnaire that collected data about the number and kind of youth media programs within established, non-profit media arts organizations and after school programs in the United States. Data collection included questions related to organizational mission, demographics, client demographics, budgets, funding sources, media production activities, and organizational challenges. The questionnaire included original questions from previous youth media surveys conducted with NAMAC since 2004. Additional questions were added to the survey in 2013 to assess capacity issues related to new media practices and platforms.
Sample Size and Characteristics
Sixty-eight (68) youth media organizations responded between April 1 and August 1, 2013. Three were discarded as incomplete with responses to fewer than 50% of the survey questions for a total sample size of 65 (n=65). Not all respondents answered every question in the survey. The total number of responses for each question is noted in the discussion for each item.
Twenty (20) respondents were from the NAMAC membership list and the other 45 were recruited from rolling sample techniques such as word of mouth and Youth Media Google Group.
A large majority of these 65 respondents represented directors, executive directors and managers who more likely to provide accurate answers to questions about organizational topics such as funding and budgets. And so the erratic response rates for this survey do not appear to be a result of the respondents’ inability to respond to the questions.
Geographic Reach
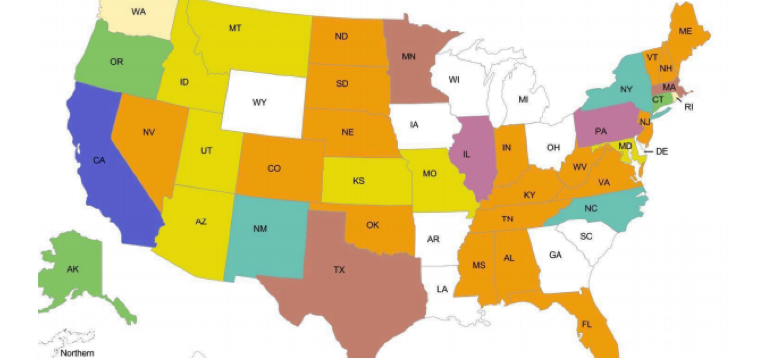
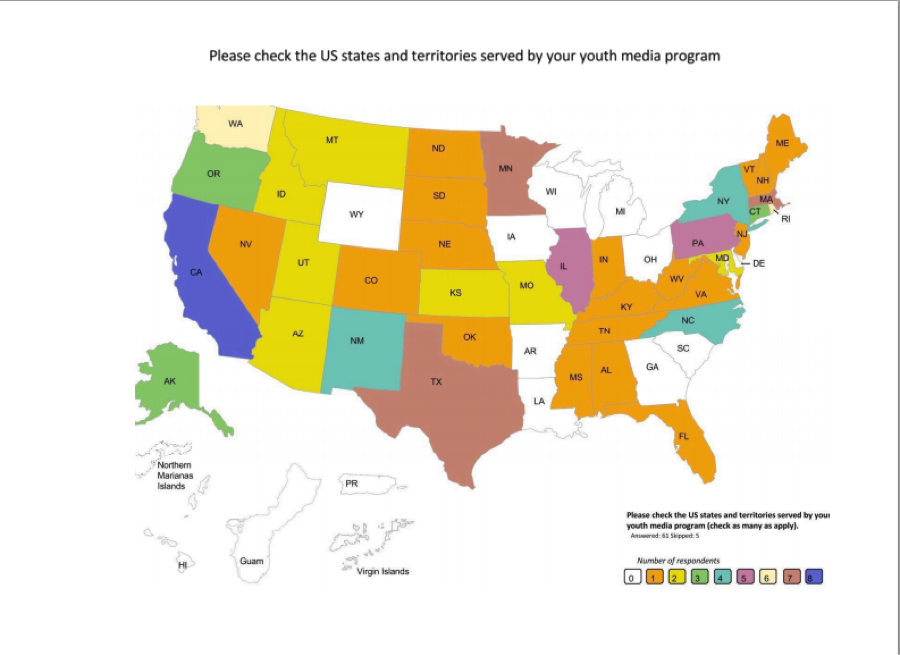
The sample represents youth media programs in 40 US states and the District of Columbia with multiple respondents in California (8), Massachusetts, Minnesota and Texas (7), Rhode Island and Washington (6), Pennsylvania and Illinois (5), New Mexico and New York (4), Alaska, Oregon, District of Columbia and Connecticut (3), Arizona, Kansas, Idaho, Maryland, Missouri, Montana, Utah (2).
One response (1) was collected from the following states: Alabama, Colorado, Indiana, Kentucky, Maine, Mississippi, Nebraska, Nevada, North Dakota, South Dakota, New Hampshire, New Jersey, Oklahoma, South Dakota, Tennessee, Vermont, Virginia, and West Virginia. The following graphic displays the geographic reach of the survey respondents.
Youth Media Organizations Geographical Reach
Organizational Mission
Respondents were asked to identify all of the aims and purposes for their program’s youth media work. In a subsequent question, they were then asked to state the number one purpose of their organization. Fifty-two (n=52) responded.
The general aims and purposes were diverse. The highest priorities given to the following: a) to encourage creative self-expression (100%); b) to give youth a voice (96%); c) media literacy (94%); and d) to build and strengthen our community (92%).
Respondents were then asked to identify one main mission for their youth media work. The question elicited a wide range of diverse responses and open-ended remarks: a) to give youth a voice (31%); b) to encourage creative self-expression (19%); to build and strengthen our community (17%); and to encourage civic participation (12%).
Table 1 ranks the aims and purposes selected by all respondents. Additional open-ended comments are included at the end of each table.
Table 1: Aims and Purposes fro your Youth Media Work
| Please select ALL THE REASONS that your organization is devoted to youth media. | ResponsesBy Frequency* (n=52) |
| To encourage creative self-expression | 100% |
| To give youth a voice | 96% |
| Media literacy | 94% |
| To build and strengthen our community | 92% |
| To encourage civic participation | 77% |
| To prepare participants for careers | 77% |
| To provide alternatives to commercial, mainstream media | 71% |
| To facilitate learning in academic subjects | 65% |
| To offer youth healthy recreational activities | 67% |
| To specifically prepare youth for careers in media | 65% |
| To protect children from the harm caused by media | 37% |
- Results may not total 100% due to rounding
Open-ended comments to this question reinforced some of the organizations social justice and youth development priorities. Respondents wrote that their work intended to: cultivate social change leaders, organize for collective power, serve as a feeder to our adult and other community programs, build curiosity and critical thinking skills, and to raise cross-generational awareness/understanding.
The respondents were then asked to identify the most important mission for their organizations. Table 2 ranks the organizations’ primary mission.
Table 2: PRIMARY MISSION FOR YOUTH MEDIA ORGANIZATIONS
| PRIMARY MISSION. Please tell us the NUMBER ONE reason that your organization is devoted to youth media: | ResponsesBy Frequency * (n=49) |
| To give youth a voice | 31% |
| To encourage creative self-expression | 19% |
| To build and strengthen our community | 17% |
| To encourage civic participation | 12% |
| To prepare youth for careers in media | 8% |
| To prepare participants for the workforce | 6% |
| To provide alternatives to commercial, mainstream media | 6% |
| To facilitate learning in academic subjects | 2% |
| Media literacy | 0% |
| To protect children from the harm caused by media | 0% |
| To offer youth healthy recreational activities | 0% |
- Results may not total 100% due to rounding
In open-ended remarks, respondents note that the diversity of these organizations make it difficult for them to identify one main mission that represents their diverse scopes of work. For those with a relationship to a larger, supporting “umbrella” organization, the articulation of aims, purposes and mission was even more complex.
“…our youth programs are quite diverse unto themselves, and because some programs come and go with funding, so tried to give the general flavor of our work.”
“Our youth media work lives at the intersections of youth leadership development, political education (i.e. root cause analysis) and media work.”
“The nature of our work at a “soft-funded” center that is part of a larger academic institution (a “private/public” university) means that it can be difficult to describe the boundaries of our professional development, workshop, and youth media programs.”
Themes across open-ended comments about the primary aims and purposes of their work are related to the cultivation of social change and youth leadership development, support for civic engagement and political education by youth, and educational offerings, especially in media literacy education. Other comments referred to their organizations mission to create pathways for populations that may be underserved in media industries, and to give youth a voice by providing multiple outlets for self-expression.
Main Mission of the Sponsoring Organizations
Twenty-five percent (25%) responded that they are a stand-alone, non-profit organization solely dedicated to youth media programs. However, the majority (62%) of the youth media programs in the survey are directly affiliated with larger non-profit organizations as their fiscal sponsors. Another 14% represent public or private school programs. Three organizations stated that they are commercial, for-profit businesses (5%) engaged in consulting and development for youth media programs. The remaining 8% of respondents identify as PEG access stations, youth media programs with a broader audience of adults, charter schools, after-school programs, and other youth development programs.
The majority (62%) of the sample that worked under the umbrella of a larger fiscal sponsor were also asked to identify the main mission of their fiscal sponsor. A large majority of the sponsored youth media programs (84%) identified arts/media arts as the main mission for their fiscal sponsors. Other missions that were stated for these sponsoring organizations were workforce development (29%), and Technology/Computer or STEM-related (18%) organizations. Social service agencies (9%), health/prevention organizations (11%), and academic/career certification programs (9%) were missions of the main sponsors. In open-ended remarks, 36% of the respondents (n=55) identified public access stations, social justice, youth and community development (23.5%).
Years of Service
The survey asked about the number of years that these organizations have been in operation (n=63). The sample reported a broad range of years in service—from 1 to 40 years. The average number of years in service for this sample was approximately 12.5 years. Four organizations were in their first year. Sixteen (26.2%) of the organizations were operational for 1-5 years, fourteen from 6-10 years (22.9%), twenty-four from 11-19 years (39.3%), and ten (16.3%) were operational for 20 to 36 years. Two (3%) reported that their organization has provided at least 40 years of youth media services. 4 did not respond.
Participants Served by the Youth Media Programs
Survey questions asked about the type of clients served by these youth media programs. The term “clients” refers to participants who receive direct services from the programs. The respondents were asked to estimate the age, income levels, gender, sexuality and demographic profiles for their clients, based on terminology used in census data collection.
Service by Race, Ethnicity
Service for a diverse range of racial and ethnic groups was reported, with some organizations reporting higher percentages of service to specific groups. All groups reported high levels of service to African American participants. Approximately 19% report high levels of service (above 50% of their participants) to African American youth, although 19% of the sample also reported that African American youth made up a smaller portion of their overall client base (under 10% of their participants).
Sixteen percent (16%) of the sample reported high percentages of service (50% and above) to Latino-Hispanic youth, with 4% reporting no service to this demographic group.
When asked about service to Caucasian/White students, 10% of the sample reported that these students made up more than half of their participants and one-fourth of the sample reported that Caucasian/White students made up fewer than 10% of their participants. Native students make up 75-100% of the client base for only a few organizations.
The organizations in this survey also reported lower levels of participation for Asian Americans. Ten percent of the sample did not serve Asian American youth and almost half (45%) of the sample reported that Asian American students make up under 10% of their participants.
Lower levels of service for some demographic groups correspond to lower percentages of some in the general population. The lowest percentage of participant service was reported for Native Hawaiian and Pacific Islanders. Forty-three percent (43%) reported no participants in this demographic category. Results also represented low participation in these youth media organizations from Native American and Alaskan Native youth. Twenty-eight percent (28%) reported no participants for these groups and 45% reported that these youth represented under 10% of their client base.
Service by Urban-Rural Location
All of the organizations served urban youth with the majority reporting that urban youth make up over 50% of their participants . Nonetheless, the majority also reported some service for rural and suburban youth, although at much lower levels. Forty-one percent (41%) reported no service to rural youth. One rural organization commented that “We have a very difficult time being compared to other youth media organizations located in urban areas that have a broader reach and easier connections with large, national outlets.”
Service by Income Levels
The programs were more likely to serve lower-income participants and 68% reported that low-income students make up over half of their participant cohort. Nearly half (46%) did not serve wealthy participants.
Service by Gender and Sexuality
Service to males and females was relatively even, with two organizations (6%) devoted to youth media programs for girls. When asked about their service for LGBT youth, 66% reported lower levels of service. However, 52% reported that they did not know the sexual identities of their participants.
Service for Disabled Students
Levels of service to disabled students was low. Although 69% reported some service, the levels of service were very low for half of the organizations. However, at least one organization was particularly dedicated to this population, noting that “We take our work with youth very seriously. It takes a lot of work, time, people, energy, etc, but it’s worth it. We work with all ages and backgrounds with special attention to youth with disabilities and English language learners.”
Service by Immigration Status
When asked about immigration status,16% reported no service to non-U.S. participants and 33% reported that under 10% of their participants were non-U.S. citizens). However, it is important to note that 27% of the sample reported that they did not know the citizenship status of their participants.
Age of Participants
As seen in Tables 3 and 4, the target population for most of the organizations was Grades 7-12. Only a small percentage of the organizations reported that they work with elementary-aged youth. Table 3 displays results for youth participants, ranked in the “none” column.
Table 3: Age Levels for Youth Participants
| by Frequency* | None | Low % | Medium | High % | ||
| Please estimate the target audience for all services through your youth media programs in the following age groups: | None | 1-10% | 11-25% | 26-50% | 51-75% | 76-100% |
| Grades 9-12 (n=52) | 0% | 2% | 6% | 27% | 25% | 40% |
| Grades 7-8 (n=49) | 10% | 18% | 37% | 25% | 8% | 2% |
| University (n=40) | 13% | 45% | 23% | 10% | 8% | 3% |
| Grades 4-6 (n=39) | 31% | 31% | 28% | 8% | 2% | 0% |
| Pre-School – 3 (n=34) | 65% | 29% | 3% | 3% | 0% | 0% |
* Results may not total 100% due to rounding.
The responses also indicate that only a small percentage of adults participate in these programs. Table 4 displays results for adult participants, ranked in the “none” column.
Table 4: Service to Adults
| by Frequency* | None | Low % of Clients | Medium | High % of Clients | ||
| Please estimate the target audience for all services through your youth media programs in the following age groups: | None | 1-10% | 11-25% | 26-50% | 51-75% | 76-100% |
| Adults: Teachers (n=35) | 26% | 51% | 20% | 20% | 0% | 3% |
| Adults: Artists (n=33) | 27% | 58% | 12% | 0% | 0% | 3% |
| Adults: Other Community Members (n=31) | 16% | 55% | 23% | 3% | 0% | 3% |
| Adults: Seniors (n=30) | 67% | 23% | 0% | 0% | 7% | 0% |
* Results may not total 100% due to rounding.
Youth Media Activities and Practices
These organizations devote their time to a broad range of services. The respondents prioritize production and programs related to direct participant services with youth in school programs. They favor both and field production and studio production. The majority reports that they spend well over half of their time working in collaborative, project‐based work. They are least likely to conduct workshops or certificate programs for adults.
Types of Youth Media Activities
When asked about the percentage of their clients who participated in various types of programs, the majority reported a high percentage of participation in after-school programs or summer camps (80%), followed by school day programs (74%) and community classes or workshops (60%). Over half of these organizations (54%) offer a teacher development program. Almost one-third offer distance education classes (31%). Table 5 Displays the percentage of time that the programs spend on youth media program activities, ranked in the “none” column.
Table 5: Time Spent on Direct Participant Services
| by Frequency* | None | Smaller % | Medium | Larger % | ||
| Please estimate the PERCENTAGE OF TIME your youth media program devoted to the following activities in the last year: | None | Under 10% | 10‑25% | 26‑50% | 51‑75% | 76-100% |
| Field Production (n=53) | 2% | 15% | 36% | 30% | 11% | 6% |
| Materials/Curriculum Development (n=49) | 8% | 33% | 39% | 16% | 4% | 0% |
| Studio Production (n=50) | 16% | 16% | 22% | 30% | 12% | 4% |
| Academic Year Student Workshops/Programs (n=51) | 16% | 16% | 22% | 16% | 24% | 8% |
| Summer Youth Workshops/Camps (n=50) | 16% | 10% | 42% | 18% | 8% | 6% |
* Results may not total 100% due to rounding
As seen in Table 5, the organizations reported that 32% of their time was spent with academic year programs such as in-school, after-school and workshop activities. Nonetheless, 16% do not participate in school programs. Over half (52%) spend small amounts of time on summer camp programs, with 14% spending a large percentage of time on summer camps. The time spent in field production is slightly higher than studio production for these programs. The organizations also spend significant time with curriculum development activities, although 8% report no time was spent with this. Table 6 displays results related to outreach and distribution, ranked by the “none” column.
Table 6: Time Spent on Outreach and Distribution Activities
| by Frequency* | None | Smaller % | Medium % | Larger % | ||
| Please estimate the PERCENTAGE OF TIME your youth media program devoted to the following activities in the last year: | None | Under 10% | 10‑25% | 26‑50% | 51‑75% | 76-100% |
| Screenings/Presentations (n=52) | 2% | 42% | 42% | 8% | 4% | 2% |
| Web Site and Social Media Outreach (n=47) | 6% | 58% | 30% | 4% | 0% | 2% |
| Distribution of youth-produced work (n=47) | 11% | 49% | 25% | 9% | 4% | 2% |
* Results may not total 100% due to rounding
As seen in Table 6, screenings and presentations of youth media work are a priority for almost all of the organizations in the survey. They are more like to use web sites and social media for other outreach activities. Although 6% spend a larger percentage of their time with the distribution of youth produced work, the majority do not spend significant percentages of their time with distribution.
When asked about activities related to adult programs, the programs reported that some of their time was spent with workshops for K-12 teachers, trainers and artists. However, over 40% did not conduct adult workshops. Programs related to professional certification for adults were rare in this survey with 87% reporting no time spent on these activities, even though 9% report that they work under fiscal sponsors with a focus on workforce development through academic/career certification programs.
Table 6: Time Spent on Adult Programs by Youth Media Organizations
| by Frequency* | None | Smaller % | Medium % | Larger % | ||
| Please estimate the PERCENTAGE OF TIME your youth media program devoted to the following activities in the last year: | None | Under 10% | 10‑25% | 26‑50% | 51‑75% | 76-100% |
| Workshops for K-12 Teachers and Administrators (n=46) | 41% | 37% | 15% | 7% | 0% | 0% |
| Workshops for Media Artists/Trainers (n=46) | 48% | 37% | 13% | 2% | 0% | 0% |
| Professional Media and Software Certification Programs (n=47) | 87% | 9% | 2% | 2% | 0% | 0% |
* Results may not total 100% due to rounding
Respondents were also asked to report the percentage of time spent on duties that are directly and indirectly related to their staff work as professionals in the youth media sector. Table 7 reports results, ranked by the “none” column.
Table 7: Time Spent on Professional Staff Activities
| by Frequency* | None | Smaller % | Medium % | Larger % | ||
| Please estimate the PERCENTAGE OF TIME your youth media program devoted to the following activities in the last year: | None | Under 10% | 10‑25% | 26‑50% | 51‑75% | 76-100% |
| Program Administration (n=50) | 2% | 26% | 42% | 24% | 4% | 2% |
| Outreach (n=49) | 2% | 37% | 45% | 12% | 4% | 0% |
| Program Evaluation (n=52) | 2% | 50% | 42% | 4% | 2% | 0% |
| Presentations at Public Events (n=49) | 8% | 65% | 18% | 8% | 0% | 0% |
| Fundraising (n=49) | 14% | 35% | 35% | 6% | 4% | 6% |
| Festivals (n=48) | 25% | 54% | 17% | 2% | 2% | 0% |
| Conferences (n=47) | 28% | 60% | 13% | 0% | 0% | 0% |
* Results may not total 100% due to rounding
Almost all of the responding organizations report that most of their time involves program administration and outreach, with smaller amounts of time also spent on program evaluation. Ten percent (10%) report that they spend over half of their time fundraising for their programs. Very few of these organizations report time for professional events at conferences, festivals and public presentations.
Activities by Medium
The organizations report that they engage in media practices in digital video (93%), photography (60%), blogs (51%), social network projects (43%) and the graphic arts (43%). Fourteen respondents engage in print publications (26%). Very few respondents in this sample do youth media production in video games (11%). Only one response reported production activities that involve creating mobile apps (2%) or virtual worlds (2%).
When asked to describe the percentage of time spent with specific genres in their programs, the majority of responses were related to documentary and narrative film production. Four responses were related to larger percentages of time with music and audio production and four others reported high percentages of time with photography. Although half spent various amounts of time across diverse genre, a large majority of the respondents spent no time at all with games, radio, traditional print, web design or the production of mobile media content. Nearly half spent no time at all with news or online publications.
Table 8: Activities by Types of Media
| Youth media programs use a wide range of analog and digital media. Select ALL the types of media produced in your youth media program (Check ALL that apply): | (n=51)by Frequency* |
| Videos (digital) | 93% |
| Photography | 60% |
| Blogs (written) | 51% |
| Animations | 51% |
| Social Network Projects | 43% |
| Graphics | 43% |
| Print Publications | 26% |
| Radio shows | 21% |
| Vlogs (video) | 19% |
| Remix and Mashup | 17% |
| Podcasts | 21% |
| Videos (analog) | 14% |
| Video games | 11% |
| Virtual Worlds | 2% |
| Mobile App Development | 2% |
* Results will not total 100% due to multiple responses and rounding
Activities by Genre
As reflected in the question about media, survey questions about specific genre produced by youth, revealed that traditional and narrative genre were most often used. Documentary dominated this sample and high percentages of youth media in narrative forms is also reported. The majority reported some percentage of work in experimental media, although less time was devoted to non-narrative genre. Most organizations in the survey also did some work with non-narrative, experimental media production. The majority worked with public service announcements, but these were reported at lower levels of production. Table 9 displays results, ranked by the “none” column.
Table 9: Types of Genre
| by Frequency* | None | Smaller % | Medium % | Larger % | ||
| Please estimate the percentage of work that students produce in the following genre. | None | Under 10% | 10‑25% | 26‑50% | 51‑75% | 76‑100% |
| Documentary (n=51) | 2% | 16% | 33% | 26% | 14% | 10% |
| Narrative/Fiction (n=51) | 8% | 29% | 24% | 29% | 4% | 6% |
| Public Service Announcements (n=49) | 14% | 45% | 25% | 16% | 0% | 0% |
| Experimental, Non-Narrative (n=47) | 19% | 45% | 19% | 17% | 0% | 0% |
| Multimedia or Transmedia (n=48) | 23% | 42% | 25% | 8% | 0% | 2% |
| Music and Audio Production (n=47) | 23% | 36% | 21% | 11% | 4% | 4% |
| Photography (n=48) | 25% | 38% | 21% | 8% | 4% | 4% |
| Online blogs or vlogs (n=44) | 39% | 39% | 16% | 5% | 2% | 0% |
| Online Publications (n=47) | 47% | 38% | 9% | 0% | 0% | 2% |
| News (n=42) | 48% | 29% | 14% | 7% | 0% | 2% |
| Radio (n=47) | 62% | 19% | 9% | 6% | 2% | 2% |
| Traditional Print Publications (n=46) | 63% | 28% | 7% | 0% | 0% | 2% |
| Web Design (n=47) | 66% | 23% | 6% | 2% | 2% | 0% |
| Mobile Media Content (n=43) | 67% | 19% | 12% | 2% | 0% | 0% |
| Interactive Games (n=42) | 88% | 10% | 2% | 0% | 0% | 0% |
* Results may not total 100% due to rounding
The majority does not work in traditional print and radio genre, however a few organizations are devoted to print and radio. In addition, some organizations focus on music, photography, news, and transmedia genre. In open-ended remarks, two respondents also mentioned their uses of animation and comics.
Although most do some work in online publications, blogs and vlogs, evidence of other types of production that requires computer design, computer networks, or coding was reported by very few of these organizations. Wide majorities did little or not work in web design, mobile media content, or interactive games.
Uses of Production Tools. The production tools reported by the organizations reflect their emphasis on traditional genre and formats. Video editing software (93%) and video recording hardware (91%) were most often used. Computers were reported by over 80% of the organizations. Audio editing and recording software was also used by 80%. Photography hardware (69%) and software (63%) was used by the majority of the organizations. Social media platforms (67%) and other online platforms (56%) were reported, as were cell phones (44%) and computer notebooks (39%). However, computer programming software was used by only 15% of this sample.
Organizational Capacity of Youth Media Organizations
In an attempt to measure organizational capacity, the organizations were queried about staffing, leadership, budgets, strategic partners and funding sources.
Staffing and Leadership
Reported number of staff for full-time, part-time and consultants ranged from 0-16 staff members and the average number of staff in each category was 3 staff members. Twenty-nine surveys identified consultants for an average of 3 consultants for this subset. The reported range for volunteer support was broad, from 0-50. However, one organization reported 1,364 volunteers.
Sixty-seven percent (67%) reported a full-time director and 21% reported a part-time director. Five organizations reported that they did not have a youth media program director and two reported that their director was a volunteer. The majority of Youth Media Program Director’s salaries were reported under $50,000 per year. Of these, 18% were under $10,000 per year and 14% received no salary.
Budgets for Organizational Partners
Approximately 9% of the sponsoring organizations budgets were under $50,000 per year and 5% reported no budget for their sponsoring organizations. Nearly 26% had budget over $1 million and of these, 3% reported budgets over $5 million per year for their sponsoring organizations. About 20% reported that their sponsoring organizations were funded in the $250- 500,000 range and 15% of their sponsors operated with budget of $500,000-1 million per year.
Budgets for Youth Media Programs
Over half (53%) of the annual youth media budgets reported were under $100,000, with 20% of these under $10,000 per year. Three percent of organizations (3%) reported no annual budget for their program. On the other end of the spectrum, 3% reported budgets between $1-5
million and 8% reported annual budgets of $500,000 and $1 million. Approximately 35% were in the $100-500,000 range with about 10% of these
reporting budgets between $150,000-250,000 per year.
Table 10: Total Budget for Youth Media Program Activities
| The budget this year for youth media programs is approximately: | Responses by Frequency* (n=60) |
| No budget | 3% |
| Under $10,000 | 20% |
| $10-25,000 | 8% |
| $26-50,000 | 10% |
| $51-100,000 | 12% |
| $100,000-150,000 | 15% |
| $150,000-250,000 | 10% |
| $250,000-500,000 | 10% |
| $500,000 to $1 million | 8% |
| $1-5 million | 3% |
| Over $5 million | 0% |
*Responses may not total 100% due to rounding.
Respondents were also asked to specify how their budgets were allocated. The majority of the budgets were spent for staff and equipment- related expenses. Very few resources were devoted to fundraising, educational resources or staff development activities.
As seen in Table 11, staff costs make up the largest line items for the organizations’ budgets with 69% reporting that over half of their budgets are devoted to staff salaries. This may help to explain why 47% report no additional stipends or honoraria for staff. Nine percent (9%) did not report costs for staff in their budgets. This may reflect some of the respondents in the sample who work from public and private educational institutions. This subsample who are employed in school systems may also be reflected in the 10% of responses that indicate no direct overhead costs.
Purchase and repair of equipment also took up a higher percentage of the budget for approximately 10% of the respondents, although 8% did not report this. Fundraising, educational materials, staff development and travel were relatively lower budget priorities for these organizations. Table 11 is ranked by the “none” category.
Table 11: Budget Breakdown
| By Frequency* | None | Smaller % of the Budget | Medium | Larger % of the Budget | ||
| Please indicate the approximate percentage of your youth media budget that goes to the following: | None | 1-10% | 11-25% | 26-50% | 51-75% | 76-100% |
| Purchase/Repair of Equipment (n=54) | 8% | 4% | 42% | 37% | 8% | 2% |
| Staff (n=55) | 9% | 4% | 18% | 33% | 31% | 5% |
| Overhead (rent, supplies, etc.)(n=50) | 10% | 44% | 38% | 4% | 2% | 2% |
| Exhibitions/Distribution of Youth Work (n=49) | 14% | 65% | 16% | 2% | 0% | 2% |
| Consultants/Contractors(n=46) | 17% | 37% | 28% | 11% | 4% | 2% |
| Travel (n=51) | 24% | 61% | 12% | 4% | 0% | 0% |
| Staff Development (n=48) | 29% | 58% | 6% | 2% | 2% | 2% |
| Purchase/rental of film/educational materials (n=45) | 29% | 64% | 4% | 0% | 0% | 2% |
| Fundraising (n=47) | 32% | 51% | 13% | 0% | 4% | 0% |
| Staff Stipends/Honorarium (n=47) | 47% | 34% | 15% | 2% | 2% | 0% |
*Responses may not total 100% due to rounding.
Funding Sources
The majority or respondents indicated that private foundations provided the largest percentage of their annual funding. Some organization received funding from local, state and corporate sources, as well as some fees for services. Relatively few of the organizations reported that a significant percentage of their funding came from federal government sources. Results are displayed in Table 12.
Table 12: Youth Media Funding Sources
| By Frequency* | None | Smaller % of the Budget | Medium | Larger % of the Budget | ||
| Please indicate the approximate percentage of funding for your youth media programs that comes from the following sources: | None | 1-10% | 11-25% | 26-50% | 51-75% | 76-100% |
| Private Foundation Funding (n=51) | 4% | 12% | 22% | 27% | 22% | 13% |
| Fees for Services (n=48) | 19% | 35% | 23% | 15% | 0% | 8% |
| Corporate of corporate foundation funding (n=48) | 13% | 50% | 23% | 10% | 4% | 0% |
| Individual Donors (n=46) | 13% | 67% | 21% | 0% | 0% | 0% |
| State government funding (n=49) | 33% | 29% | 25% | 10% | 4% | 0% |
| Local government funding (n=50) | 34% | 32% | 16% | 12% | 4% | 2% |
| Federal Government Funding (n=47) | 47% | 23% | 17% | 11% | 0% | 2% |
| Sales/Gate From Distribution or Exhibition of Work (n=41) | 68% | 27% | 2% | 2% | 0% | 0% |
| Advertising (n=42) | 95% | 5% | 0% | 0% | 0% | 0% |
*Responses may not total 100% due to rounding.
The majority indicated that private foundations provided the largest source of funding for these respondents, followed by fees for services. State and local government sources were important to several organizations but approximately one-third of the sample reported no income from these sources. Levels of federal funding were low, with 47% reporting no federal funding sources.
Strategic Partnerships
It is important to note that funding for some of the organizations and consultant in the survey may come to them indirectly in the form of a contract or sub-contract from another agency. In addition, these partnerships create opportunities to apply for larger grants, especially in the government-funded sector, thus building each organization’s scope and capacity to fund and expand their programs. One respondent commented, “We primarily seek partnerships with local, national, and international groups to evaluate, create curriculum materials, and raise visibility within the media literacy and youth media communities.”
The organizations in this survey primarily partner with other non-profits (90% and with public schools (87%). Increasingly, higher education (58%) and museums (42%) are potential partners, especially for media arts and STEM programs. Approximately one-third reported partnerships with private K-12 schools (36%) and libraries (32%). Thirty-one percent (31%) partnered with community colleges. Table 13 displays results related to the strategic partnerships for these youth media organizations.
Table 13: Strategic Partnerships for Youth Media Organizations
| Does your youth media program partner with any other organizations? | N=59 |
| Non-Profit Organizations | 90% |
| Public Schools | 87% |
| Colleges/Universities | 58% |
| Museums | 42% |
| Private Schools | 36% |
| Libraries (Public) | 32% |
| Community Colleges | 31% |
| For-Profit Organizations | 29% |
| Libraries (School) | 19% |
*Responses may not total 100% due to rounding.
In open-ended remarks related to strategic partnerships, respondents stated:
“We primarily seek partnerships with local, national, and international groups to evaluate, create curriculum materials, and raise visibility within the media literacy and youth media communities.”
“We are trying to strengthen our educational outreach as there is a strong desire for it within the community, but it will only ever be in the form of workshops and labs, we are not a teaching institution.”
Supports and Challenges for Service Delivery and Sustainability
Funding is one only threshold for service delivery and sustainability. Results related to the supports and challenges for these organizations provide insights into strategies for capacity building and sustainability for youth media organizations. Respondents were asked to rate barriers for service and challenges to sustainability of their organizations on a scale of 1=Low/4=High.
Research for youth development programs reflects a socio-cultural-ecological approach to recruitment, engagement and retention of participants 9. Chief among these barriers are transportation, location, cultural relevance, interest, and trust. In addition, young people often have a busy schedule, including family and work duties that may compete with their involvement with youth media organizations. Many of these challenges also resonate with other youth development organization’s barriers to service in the social service sector.
Barriers to Service Delivery
The organizations were asked to rank barriers to service on a scale of 1=Low/4=High. Several items on the scale were not applicable or not a problem for a few of these organizations. None of the organizations cited staff turnover, staff development, a need for help with curriculum design, inter-generational communication, awareness of their program, or accessibility of their youth media activities or funding as barriers to participants’ access to their programs’ services.
Table 14: Barriers to Service Delivery
By Frequency & Mean
| Please RANK participants’ barriers to your services on a scale of 1=LOW and 4=HIGH: | Not Applicable to my organization | Mean Responses 1=LOW and 4=HIGH |
| Students have too many other activities (n=51) | 0% | 2.65 |
| Poor transportation options (n=51) | 2% | 2.47 |
| Student mobility/retention (n=51) | 0% | 2.36 |
| Access to Technology Tools (n=51) | 2% | 2.12 |
| Participant Recruitment (n=51) | 2% | 1.80 |
| Access to Technology Knowledge (n=51) | 4% | 1.73 |
| Language barriers (n=51) | 6% | 1.57 |
| Location for our youth media activities present security risks (n=50) | 4% | 1.34 |
On average, none of the barriers were ranked at a high level. The youth media respondents reported that the biggest barrier was that student have too many other activities, followed by poor transportation options for students and access to technology tools. Issues related to participant retention were problematic for some organizations, but participant recruitment was even less significant for these organizations.
Barriers to Sustainability
Respondents were asked to rate barriers to their organization’s sustainability and capacity to deliver services. Table 15 ranks responses by mean average.
Table 15: Barriers to Sustainability
* By Frequency & Mean (n=51, unless otherwise noted)
| Please RANK participants’ barriers to your services on a scale of 1=LOW and 4=HIGH: | Not Applicable to my organization | Mean Responses 1=LOW and 4=HIGH |
| Funding for our program | 8% | 3.14 |
| Public Awareness of our program | 4% | 2.45 |
| Staff’s need for more support/training to work effectively with youth | 4% | 2.16 |
| Need Help with Planning for the Future | 6% | 2.14 |
| Opportunities to evaluate the impact of our program activities | 4% | 1.98 |
| No centralized place to store and share our media products with the field | 6% | 1.78 |
| Too much competition with our youth development programs (n=50) | 6% | 1.72 |
| Counseling for youth in need of adult support (n=50) | 12% | 1.76 |
| Recruiting staff | 4% | 1.71 |
| Staff Turnover | 4% | 1.67 |
| Need Help with Curriculum Design | 6% | 1.57 |
It is important to note that the diversity of the organizations contribute to a wide range of rankings for issues related to capacity and sustainability. As expected, funding was a concern for all of the organizations, with 55% of the sample rating it as a very significant barrier. Other concerns were related to public awareness of their programs, staff training and the need for strategic planning opportunities.
Staff development issues, including recruitment, retention and training were also a concern. Public profiles and awareness of their programs in the community, and opportunities to evaluate the impact of their programs was a challenge for many organizations.
In open-ended remarks, individual respondents cited funding for staff positions (3 respondents), students’ family demands (4), and high demand for their services (2). One noted that scheduling difficulties with schools around testing was a significant barrier to their service delivery.
Outreach and Distribution
In relation to the organizations’ concerns about public awareness as a sustainability strategy, the questionnaire contained items related to opportunities to promote the work of these organizations. Most of the organizations used the web (96%), YouTube or Vimeo (90%), public screenings at local showcases (89%) and festivals (69%) to distribute the youth work. Others used cable (33%) or broadcast (25%), print (21%) or radio (21%). Nearly one-third of the organizations (31%) distributed their curricular products. Press placements were used by approximately one‐third of the sample. Fourteen respondents skipped this item.
When asked specifically how the media that youth produce is used to promote and recruit participants, 52 organizations relied on word of mouth, as well as their websites (94%), social media (89%), targeted emails (83%) and community events (81%). Over one-third (39%) relied on targeted press placements, including school newspapers, and 33% relied on mainstream press. One organization reported that they worked with a professional distributor, another made visits to potential educational partners, and 12% relied on paid advertising for visibility.
Discussion of Results
Mapping the Field of Youth Media: Results of An Environmental Scan of Youth Media Organizations in the United States reveals a tenacious core of youth media practitioners who intersect with a wide spectrum of traditional educational, social justice and youth development efforts. With high demand and low budgets, these organizations are fueled by the commitment and passion of local youth media practitioners who shape and customize the agenda for media production, site-by-site. The purpose of the study is to investigate the nature, scope and capacity of these organizations so that results may be used to assess need, impact and strategies for sustainability. In addition to its uses in field building, it is also hoped that the study can also contribute to an emerging, mixed methods research base that promotes the study of youth media programs and their contributions to their communities.
The survey results indicate that the providers of youth media education in the US are non-profit or volunteer organizations who often operate under a larger non-profit which are often affiliated with the media arts. Nonetheless, there is a sizeable contingent who run youth media programs without the benefit of a larger fiscal partner. Most of these are not new organizations. On average, the organizations have been providing youth media programs for 12.5 years, with some in business for decades.
The majority of the organizations in this sample serve relatively large cohorts of diverse participants with limited resources. Most depend on foundation funding with limited government support or fees for services. The organizations are more likely to serve local, urban communities. Although some of these community-based programs also serve adults in their communities, especially teachers, the majority are devoted to youth, primarily adolescent youth.
The Aims, Purposes and Mission of Youth Media Programs
The history of youth media production in the United States is grounded in broader trends for youth development and community-based media production for a diverse range of media makers. Contemporary youth media practices can be traced to related programs in cable access television, non-profit arts programs, digital literacy efforts, and youth development organizations 10. In all of these cases, as access to production equipment, knowledge and audiences became less costly and cumbersome, a wider range of media production opportunities across diverse platforms were used to engage and connect young people with the media tools and distribution outlets that could best support and amplify their “voice.” In the process, these activities reveal a wide range of aims and purposes, such as artistic expression, workforce development, life skills development, education, community participation, and the resolution of social inequities.
Past studies in the NAMAC Mapping the Field series indicate that “youth media” encompasses diverse interpretations about the nature and purpose for the work. The 2013 study is no exception. Research indicates that diverse definitions for the term “youth media” are used, sometimes conflating media produced by youth with media produced for and about youth. For the practitioners in this study, “media conceived, developed and produced by youth and disseminated to others,” is an operational definition. 11.
Nonetheless, when asked to articulate their various missions, the organizations in this study also reported a wide range of aims and purposes for youth media programs. These run the continuum from support for individual to collective expression and encompass values and goals from both youth development and community development perspectives. In this regard, the responses raise questions about the kind of consensus necessary to promote youth media as its own field. Instead, the results indicate that these organizations operate as an outgrowth of general youth development work, as a strand of community activism, as support for general academic or career pathways for youth, or all of the above.
The sample’s strong affiliation with creative production and the media arts is reflected in their purposes and activities, such as “to encourage creative self-expression” and practices that involve experimental, non-narrative media forms. The results indicate that while there is some consensus around “giving youth a voice,” the aims and purposes of youth media production differ widely between programs engaged in general youth development work, such as social service and prevention work, and those with a focus on fine arts and activist communities. Themes related to youth media as a way to “strengthen communities” play on the concept of voice and representation in the goal of social justice, critical autonomy and equity. Most of the organizations refer to the goals of encouraging civic participation and providing alternatives to mainstream media. Although youth media activities are seen as a way to “prepare participants for careers,” they are less likely to see this as a pathway to specific media careers. Most want to build media literacy skills, yet 37% of the sample did not frame media literacy from a protectionist approach that protects children from harm caused by media.
Although media literacy is a goal for 94% of the sample, it is not cited as a primary mission in the sample. Furthermore, there is evidence that most of the time spent with program activities are centered around production. Nonetheless, the majority of the sample reported either no budget (44%) or very low funding levels (44%) for equipment purchase or repair. These responses raise questions about the degree to which these organizations support and bridge the two domains of critical media analysis and critical media production that provide fertile areas for further research.
When asked to select only one mission for their work, 12 of the organizations did not respond. The remaining responses demonstrate diversity and little consensus. The top missions selected were to give youth a voice (31%), encourage creative self-expression (19%), build and strengthen our community (17%) and encourage civic participation (12%). Workforce development (6%) preparation for media careers (8%) were the main mission for only one organization cited academic learning (2%) as the main mission. Given the diversity of these missions and consensus about the way that youth media programs have the potential to “give youth a voice,” more research is needed to explore the specific contexts and characteristics for the contemporary concept of “voice” in youth media.
Sites of Practice
The relationship between formal and informal education further complicates the concepts necessary to frame the field of youth media. Notably, the concept of “youth media” does not have a strong association with formal education in the US, although media production undoubtedly takes place during the school day in many institutions. For example, public and private school newspapers are common in public schools and represented in this sample, although recent studies indicate that traditional print media programs may be in decline 12. In addition, formal education settings devoted to digital, gaming and electronic forms of transmedia production are beginning to emerge and the nature of these participatory production activities for learning is in need of further research 13. This study indicates that youth media programs increasingly connect with formal educators through after-school and summer camp programs. The association between formal educators and youth media practitioners during the school day is a core component for these practitioners’ programs.
Scholars have noted that the accountability, discipline-based education and traditional pedagogies associated with formal education support a practical “ed tech” approach that can create tensions with the experimental, participatory, ideological and activist missions of some youth media programs. Henry Jenkins and others have called this emphasis a “participation gap” 14. As expressed by the UNESCO Communication and Information Sector:
Access to information does not define itself only in terms of access to different technologies and media, but must take into account the nature and type of information youth need for full participation in society 15.
In theory, strategic partnerships with formal and informal educators raise the capacity for both groups to meet the demand for participation in youth production programs. In the process, these partnerships also have the potential to build the field of youth media by engaging more practitioners as advocates.
Results from this study indicate that the production and distribution of media by youth are currently focused on participatory knowledge and production in informal, community-based and after-school spaces. Whether this indicates an alternative to limited offerings and traditional technology instruction addressed in formal schooling is unclear and are grounds for further research.
Although public schools provide educational technology and access opportunities for their students, in recent years these opportunities have diminished due to shortages in funding and qualified IT personnel and the inordinate emphasis on standardized testing. As schools begin to plan—and raise funding– for renewed digital literacy integration in a climate of testing and workforce development, the educational technology agenda appears to focus on hard and soft technology skill assessments that address the perceived needs of employers and bureaucratic practices related to standardized testing and assessment. Nonetheless, the study provides some exceptions to this perspective, particularly with the larger organizations who operate during the school day.
Partnerships between community-based youth media programs and formal education institutions build the capacity for all stakeholders. In particular, schools can take advantage of practitioners’ media production expertise–skillsets that may not be widely available to teachers at an interdisciplinary level. However, these strategic partnerships offer both opportunities and challenges for youth media organizations. Although strong partnerships with formal educators provide a much-needed way to build organizational capacity and spread, efforts to bridge formal and informal education may also compromise the resources and distort the mission of community-based groups. In particular, content-delivery modes of instruction, rigid schedules, limited access to artistic equipment and practices, and limited space for ideological discourse are barriers to the core work of youth media practitioners. If formal educational institutions hope to remain relevant in the face of burgeoning production practices, these youth media organizations provide a vital resource for school change efforts. In addition to modeling a blended critical literacy and skill-based curriculum across media platforms, youth media programs field-test participatory pedagogies that exemplify innovative designs for contemporary learning environments.
This is not to say that the organizations in this survey are focused on a high level of digital media production. The majority of the sample report that although they work in digital formats, most of their work is in traditional documentary and narrative forms of moving image media. Traditional radio, print and music still have a smaller but solid presence in the sample. Even web design is not engaged by 66% of the respondents, although the majority used the web for distribution of student work and visibility. Also, in spite of the fact that graphics and social media are acknowledged by these programs, the practices for this sample do not appear to transition into more sophisticated computer production for games or mobile apps. The marginalized uses of virtual worlds, gaming and mobile application development in these programs deserves more investigation. And so the question remains: In an era of high digital access, where are young people finding opportunities to refine their every day knowledge of digital environments and related critical production skills?
Challenges and Support for Sustainability
The organizations identify barriers to service that are common in other youth development programs. These include recruitment and retention factors such as transportation, students’ choices of activities, and student mobility. Access to media tools was also cited. However, it is important to note that these barriers were not considered high with a mean scale of 1.34 to 2.65 on a scale of 1=Low/4=high.. More research is needed to analyze barriers by investigating responses in relationship to subsamples of organizational characteristics.
The challenges to the organizations’ overall sustainability were somewhat higher on a scale of 1=Low/4=High. These included funding (mean 3.14), public awareness of the program (2.45), staff development (2.16), opportunities for impact evaluation (1.98) and strategic planning (2.14). Policies and funding priorities that target these areas for strategic planning have the potential to support sustainability. In addition, more evidence of impact contributes to the research base and identifies best practices that can be widely shared with other youth media practitioners, thus contributing to sustainability.
As advocates work to build the field, this wide range of practices and purposes present both supports and challenges for youth media practitioners. Supports for field building include the broad vision and inclusiveness needed to provide a strong base of consensus among advocates for youth media. When viewed in this way, the diversity of missions and activities could be seen as a challenge to field building. However, when seen in the context of community-based media, the diverse aims and purposes of youth media may also serve as a support for the emerging field. When characterized as a dynamic process instead of a well-defined practice, this breadth and ambiguity has the potential to reach out across interdisciplinary, inter-agency sectors. In particular, youth media can be seen as a timely and flexible way for communities to use media to respond to changing social concerns and related communication practices.
In 1999, John Higgins foreshadowed this discussion in his historical analysis of community television as process:
Community television as process conceptualizes constant change within individuals and the collectives within which they participate. Community television as a process addresses the criticisms that video training in the access context focuses on technology as a panacea for social ills. Instead, video training and participation is seen as a means to an end rather than the objective itself, where individuals and groups become confident in awareness and skills necessary to shape the world of television and move on to sculpt the social world. The process orientation is purposes, such as those suggested by the new media and data technologies 16.
Conclusions
The organizations that participated in Mapping the Field of Youth Media 2013 are indicative of a an emerging field with committed advocates who provide media production opportunities for a diverse audience of young people. The broad missions and practices for these programs are represented in every aspect of the study, from the demographics of the clients served, to media and modes of production, and activities.
What remains clear is that these programs offer a “lifeline” for individual youth in
traditionally underserved communities. In this sense, support for the individual young people who participate in their youth media activities is seen as paramount to the success and impact of these youth media programs 17.
In addition, the involvement of the young people in shaping these organizations also represents the kind of inter-generational mentoring and internships that build both hard and soft skills. In the process, these organizations remain agile and flexible as they serve their communities.
[Our organization] has seen many changes over the years – [we are] part of a national organization…a program of a larger organization [a museum] and an independent nonprofit organization. [We have] diversified its media outputs, adding the web, radio and audio slideshows to its print production. It has been encouraging to hear young people determine the best output for the potential story, which really helps them understand the medium. But most importantly, leadership decisions have always been made with [an organization of young alumni from the program]….All outgrowths of young people see media as an opportunity to tell stories and have their voices count.
The Mapping the Field of Youth Media 2013 study is one small contribution to a growing research base about the nature and impact of youth media production programs in the United States. The study is intended to provoke increased dialogue that helps to build the capacity of these organizations to fill the demand for their services as they navigate volatile changes in community education, civic participation and the generational shift into a digital world.
Acknowledgements
Thanks to Aggie Ebrahimi Bazaz and Jack Walsh of the National Alliance for Media Arts and Culture (NAMAC) in San Francisco, CA for their continued support.
Kathleen Tyner, Associate Professor, Department of Radio-Television-Film, The University of Texas at Austin, ktyner@utexas.edu
Thanks to:
| Alaska Teen Media Institute | |
| Appalshop’s Appalachian Media Institute | |
| Aurora Picture Show | |
| Austin Film Society | |
| Bay Area Video Coalition | |
| Beacon Charter High School for the Arts | |
| Center for Media and Information Literacy | |
| Children’s Media Project | |
| Columbia Links | |
| Community Film Workshop of Chicago | |
| CTV North Suburbs | |
| CyberWise.org | |
| Educational Video Center, Inc. | |
| Elsewhere | |
| Free Spirit Media | |
| Gandhi Brigade | |
| Global Action Project | |
| Harken Youth Media | |
| HYPE | |
| ILA VIetnam | |
| In Progress | |
| Independent Filmmaker Project Minnesota | |
| Jack Straw Productions | |
| Kansas City Public Library | |
| KBOO Community Radio | |
| La Salle academy | |
| Magic Box Productions | |
| Manhattan Neighborhood Network | |
| Media Arts Center San Diego | |
| Media Literacy Project | |
| Migizi Communications | |
| Minneapolis Television Network | |
| Mississippi Public Broadcasting | |
| Nickelodeon Theatre | |
| Northwest Film Center | |
| Open-Ended Response | |
| Real Art Ways | |
| Reel Grrls | |
| San Francisco Film Society | |
| SAY Sí | |
| Scenarios USA | |
| Screen Savvy Kids | |
| Scribe Video Center | |
| SEAMAAC | |
| Somerville Community Access Television | |
| Southwest Alternate Media Project (SWAMP) | |
| Spy Hop Productions | |
| St. Paul Neighborhood Network | |
| Stories From Deep in the Heart, a project of Texas Folklife | |
| Street-Level Youth Media | |
| Swept Away Media | |
| TAPA: Trinity Academy for the Performing Arts | |
| The Institute of Contemporary Art/Boston | |
| Thurston Community Television | |
| TILT at Ninth Street Independent Film Center | |
| Union Station Kansas City, Inc. | |
| Venice Arts | |
| Video Association of Dallas | |
| Vision Maker Media | |
| WCCA TV 13 “The People’s Channel” | |
| Westerly High School Video Communications | |
| Y-Press | |
| Yollocalli Arts Reach – National Museum of Mexican Art | |
| Youth Media Project | |
| Zumix | |
- Tyner, K. “Youth Media and Social Change: One Perspective from the Field.” Youth Media Reporter. May, 2007. pp. 110-118. Accessed April 15, 2014. http://www.academia.edu/1104306/Youth_Media_and_Social_Change_One_Perspective_from_the_Field. ↩
- Buckingham, D. “`Creative’ Visual Methods in Media Research: Possibilities, Problems and Proposals.” Media, Culture & Society31 (2009): 633-52. ↩
- Gauntlett, David. Making Is Connecting: The Social Meaning of Creativity, from DIY and Knitting to YouTube and Web 2.0. Cambridge, UK: Polity Press, 2011. 286. ↩
- Kafai, Y. B., and K. A. Peppler. “Youth, Technology, and DIY: Developing Participatory Competencies in Creative Media Production.” Review of Research in Education 35 (2011): 89-119. ↩
- Solé, L., and J. Torrent. “Youth Media Visions.” NY: Columbia Teacher’s College and the United Nations Alliance of Civilizations. January 1, 2013. Accessed August 31, 2014. http://milunesco.unaoc.org/wp-content/uploads/2014/08/Final_YMV_Book_pF100.pdf. ↩
- Asthana, Sanjay. “Innovative Practices of Youth Participation in Media. A Research Study on Twelve Initiatives from around the Developing and Underdeveloped Regions of the World.” UNESCO.ORG. January 1, 2006. Accessed May 1, 2013. http://portal.unesco.org/ci/en/ev.php-URL_ID=22831&URL_DO=DO_TOPIC&URL_SECTION=201.html. ↩
- Bohlen, N., D. Pontecorvo, and K. Putnam. “Youth Media: I Exist. I Am Visible. I Matter.” Youth Media: I Exist. I Am Visible. I Matter. January 1, 2006. Accessed April 15, 2014. http://www.issuelab.org/resource/youth_media_i_exist_i_am_visible_i_matter. ↩
- “NAMAC 2013 Mapping the Field Youth Media Survey.” National Alliance for Media Arts and Culture (NAMAC). Accessed August 31, 2014. http://www.namac.org/sites/default/files/MappingYouthMedia-2013-Prelim.pdf. ↩
- Lawson, M. A., and H. A. Lawson. “New Conceptual Frameworks for Student Engagement Research, Policy, and Practice.” Review of Educational Research, 2013, 432-79. ↩
- Tyner, K. “Media Literacy and the Tyranny of the Narrative.”AfterImage: The Journal of Media Arts and Cultural Criticism 372 (2009): 3-10. ↩
- Campbell, P.B., Hoey, L., and Perlman, L. “Sticking with My Dreams: Defining and Refining Youth Media in the 21st Century.” Campbell-Kibler. February 1, 2001. Accessed May 1, 2013. http://www.campbell-kibler.com/youth_media.html. ↩
- Hu, Winnie. “At School Papers, the Ink Is Drying Up.” The New York Times. May 27, 2013. Accessed May 27, 2013. http://www.nytimes.com/2013/05/28/nyregion/at-school-papers-the-ink-is-drying-up.html?pagewanted=all&_r=0. ↩
- Squire, K. “Open-ended Video Games: A Model for Developing Learning for the Interactive Age.” The John D. and Catherine T. MacArthur Foundation Series on Digital Media and Learning: 167-98. Accessed August 14, 2014. http://website.education.wisc.edu/kdsquire/tenure-files/12-macarthur-book-salen-squire.pdf. ↩
- Jenkins, H., K. Clinton, R. Purushotma, A.J. Robinson, and M. Weigel. “Confronting the Challenges of Participatory Culture: Media Education for the 21st Century.” January 1, 2006. Accessed May 27, 2013. http://digitallearning.macfound.org/site/c.enJLKQNlFiG/b.2108773/apps/nl/content2.asp?content_id={CD911571-0240-4714-A93B-1D0C07C7B6C1}¬oc=1. ↩
- “Youth and ICT.” UNESCO. 2008. Accessed May 1, 2014. http://portal.unesco.org/ci/en/ev.php-URL_ID=1537&URL_DO=DO_TOPIC&URL_SECTION=201.html. ↩
- Higgins, John W. “Community Television and the Vision of Media Literacy, Social Action, and Empowerment.” Journal of Broadcasting & Electronic Media: 624-44. ↩
- Tyner, K. “Mapping the Field of Youth Media Organizations in the United States.” In J. Fisherkeller (Ed.), International Perspectives on Youth Media: Cultures of Production and Education. pp. 25-49. New York: Peter Lang, 2011. ↩